Thursday, 20 January 2011

Flash Induction


We were given a set of images to work with for the workshop.  The first thing we had to do was resize the images, which could have been done one-by-one, but because of the amount we had it was unnecessary.  
So:
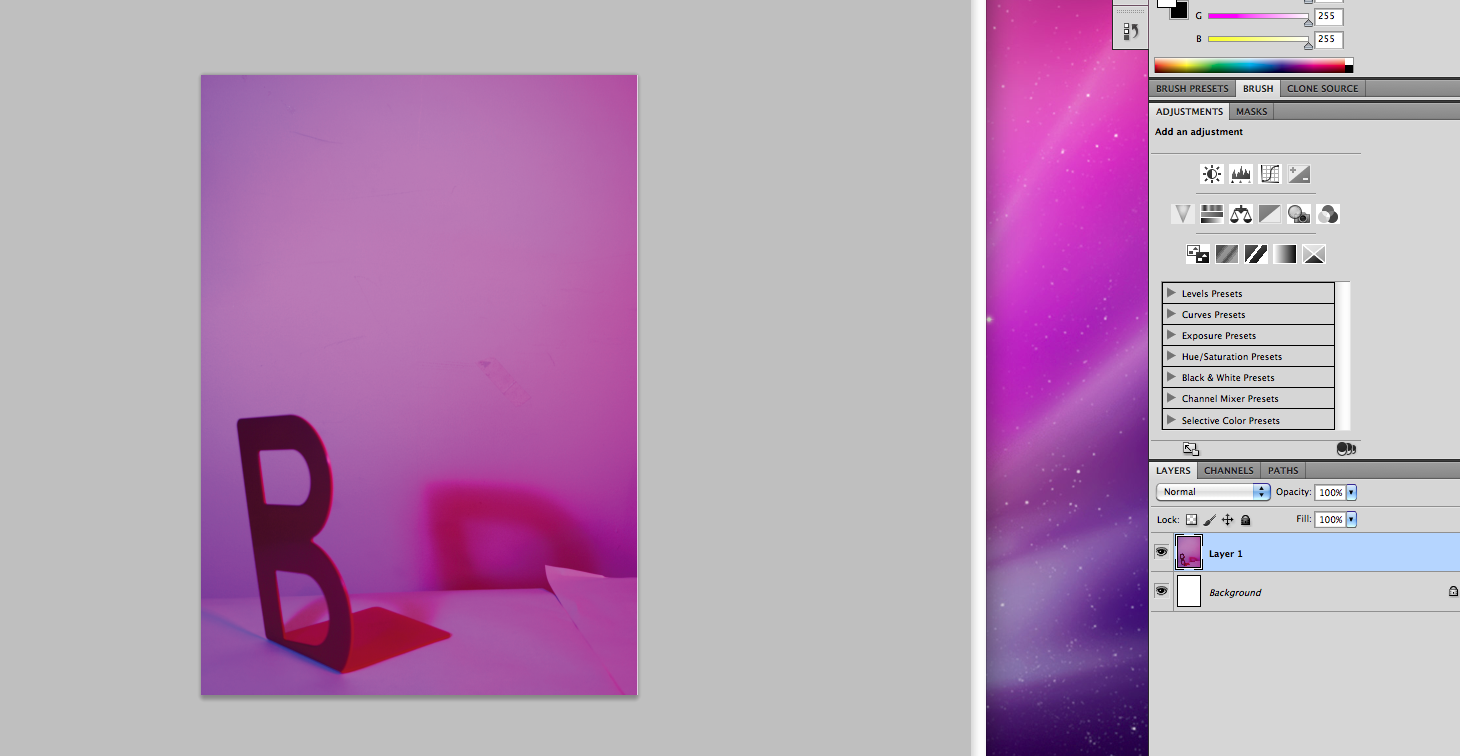
-First place one of the images into Photoshop for resizing.
-Before changing the image size you must select the 'Actions' toolbar from the 'Window' menu.
-Select a new action and press 'record' as below.


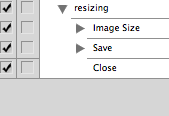
- Once you are recording you resize the pixel width to '720'.
- Then save the image.
- Then close the image.
- After this stop recording and the action will be saved.


- Next you must click 'File', down to 'Automate' then onto 'Batch' and select where the work is coming form and where it will be saved.
- Once saved close Photoshop and open Quicktime Player 7 and select 'Open image sequence' and enter the location of the Photoshop files just saved.
- Select 'Open' and a frames per second option will pop-up.  (This works by trial and error so select an option in the middle to begin with to check it out) 


Untitled from Charlotte Bourke on Vimeo.

Change? Collection 100

From the majority of my visual research I have found that most people tend to have change kicking about in the bottom of their bags.
Direction-
-Could perhaps focus on change.  Involve stats, i.e. Out of 100 bags, so many of them had change inside, this change amounts to so much,  - A fairly considerable amount given the nature of how it got there (people not being bothered to put it in their wallet/ purse when receiving it, so just throwing the change into the bottom of their bags.)  Develop some kind of product that solves the problem?
-Another direction could include infographics on how much money is discarded in the bottom of bags and categorise them into what type of coin they are?

Wednesday, 19 January 2011

Grids, Type and more "Stuff"


General layout taken from a music magazine.  I've found that from this I need to be more specific and focus in on things like what typeface I am using and also research more into official terms to create a more precise piece that would be ready to go to print. 

Monday, 17 January 2011

Infographics, Collection 100

I think experimenting with infographics is an interesting way to approach the brief with the amount of research i've obtained.  
In the studio session we experimented with information from our life in education to make our own piece of infographics.  Below is what I came up with.
The symbols next to the text represent it is a whole.


Above is a timeline representing my life in education using the 
information above, but rather than using that information as text we 
used the symbols represent that information, creating a more visually 
engaging piece.


This is now condensed, each symbol and it's spacing 
representing the information above.


These are two variations.  I decided to change the circular symbol to a triangle to fit the straight edged theme.  I have also overlapped some of the symbols to represent time overlapping, and have also placed certain symbols on top of each other to show that these things happened on exactly the same day.
Below that is a more simplified version that just shows the outline and still represents the same information.  I think this is a really interesting way to show sometimes mundane information and is something I have never thought of doing before.


Tuesday, 11 January 2011

Grids, Type and "Stuff"

Type:
The X-height is the size of the distance between the baseline and the top of lower case letters within type.  Depending on the typeface the way the body is filled can change the x-height.  The x-height in Sans Serif typefaces is typically larger because the ascender and descender aspects of the letterforms being smaller.  
As a rule, the 'O' in type always sticks slightly above and below the x-height because optically it would look smaller s it was the same. 


Readability:
- Changing the typeface can increase its' readability if it reflects the general mood of the words.  
- It is a common misconception that capital letters increase readability, this is not true.  If grammar is used correctly then readability is increased.  It separates words and draws attention to specific areas of type.
- Kerning; the space between a pair of letters.  This can increase readability by spacing the letters apart.  I.e. 1958 and 1 958.
If you wanted the focus on the number 1, then you would do as above.  The negative space around the number draws attention to it. 
- If the type was reversed out (for example) it can go either way, depending on the content.  Usually the tracking has to be increased when reversing out because optically the black creates less negative space around the letterforms.
-Increasing the tracking will create more space between a group of letterforms making it more open (or closed)- so can increase readability in that sense.  You can also set the tracking for letterforms to overlap each other, purposefully decreasing readability.


Appropriateness: 
Fonts can be descriptive of words.  If the viewer has an understanding of popular culture (even without realising) then the type of font will successfully intensify reinforce its' meaning.
The well known site dafont.com is a good example of appropriateness.  It categorizes different styles that reflect their heading.  For example, I found this font in the category 'Destroy':


It successfully reflects the word 'destroy' because of what the word connotes.  It conjures up imagery of rough textures, things being smashed and impact.  All of which in my opinion are visible in this typeface.  It is appropriate because the viewer can relate to this idea of destruction because the designer has incorporated the things that are associated with the subject they are trying to get across- it even heightens the message.


Layout:
Layout is key.  A change to somethings layout emphasises different areas in a design.  
For example, a manual needs large page numbers because the viewer will usually be referencing different languages, areas in relation to what stage they are at, and different problems with their product- it isn't a novel, they know where they need to be and don't need to read the whole thing.  You must design appropriately to the content.


The Grid:
The design of a grid is also designed appropriately to its' content.  For example a play scrip has a basic and specific design that enables the reader to read the type in the simplest way possible.


Above is the practical aspect of the seminar.  We had to decide what the layout for the newspaper was through analysing different columns from different pages.  This is what we came up with.  


Below is another grid design for the magazine 'Private Eye'.


It is not as complex as 'The Guardian'.  Perhaps this is because The Guardian has a much wider audience than Private Eye, so therefore has many different articles that this audience have to respond to.  The layout aids in reinforcing the message of the article- they need the freedom to be able to make an image larger, or increase the size of a quote.  

Tuesday, 21 December 2010

Typogateax, 'If Comic Sans were a cake'.

Well, what can I say.
Me and Sarah clearly do not have the skills of baking.


We named it, 'If Comic Sans were a cake'.